Peptide Molecular Weight and Purity: What They Mean
What the molecular weight and purity figures on a peptide COA actually measure, how they are generated, and how they relate to net peptide content.
 EMElena Marsh, PhDSenior Research Analyst, Analytical Chemistry~6 min read
 Analytical QCPhoto: Kjaergaard / Wikimedia Commons
Two numbers dominate almost every peptide certificate of analysis: a molecular weight and a purity percentage. They look simple, yet each compresses a specific measurement, a specific calculation and a set of assumptions into a single figure. Peptide purity, for example, usually describes the share of UV-absorbing material that elutes as the main chromatographic peak, not the fraction of the vial’s mass that is peptide. Molecular weight can mean a theoretical value calculated from the sequence or a mass observed on an instrument, and either can be expressed as an average or a monoisotopic mass.
This article explains what each value represents, how it is generated in the laboratory, and why a third figure, net peptide content, is often reported separately. Read together, the three give a far more accurate picture of a research material than any one of them alone.
Theoretical versus observed mass
The theoretical molecular weight of a peptide is calculated, not measured. Starting from the amino acid sequence, the analyst sums the residue masses, adds one molecule of water to account for the free N- and C-termini, and then adjusts for modifications: C-terminal amidation, N-terminal acetylation, disulfide bridges (each removes two hydrogen atoms), metal complexes or non-standard residues. Because every peptide bond forms with the loss of water, the residue masses used are those of the free amino acids minus H2O.
The observed mass comes from a mass spectrometer. The instrument measures the mass-to-charge ratio (m/z) of ionized molecules, and software converts those readings into a neutral molecular mass. Agreement between observed and theoretical mass, within the accuracy of the instrument, is the main evidence that a sample contains the intended molecule. A discrepancy can point to a missing residue, oxidation, a salt adduct, or a calculation that used the wrong type of mass. Any description of how peptides are analytically tested, such as a peptide purity testing summary, should make clear which instrument class and tolerance apply.
Average versus monoisotopic mass
Most elements occur as more than one stable isotope; carbon, for instance, is roughly 99% 12C and 1% 13C. That gives two legitimate ways of expressing a molecule’s mass.
The monoisotopic mass is calculated using only the most abundant isotope of each element (12C, 1H, 14N, 16O, 32S). It corresponds to the lightest peak in a resolved isotope cluster and is the value normally compared with high-resolution spectra of small and mid-sized peptides. The average mass weights each element by its natural isotopic abundance. It is the appropriate figure for stoichiometric work, such as converting a weighed amount into moles, and for comparison with lower-resolution spectra in which isotope peaks are not separated.
The gap between the two grows with molecular size. For a short peptide it is well under one dalton; for a peptide of several kilodaltons it can amount to a few daltons, and the monoisotopic peak itself becomes a minor part of the isotope envelope. When a certificate lists a molecular weight without saying which kind it is, comparing it with a monoisotopic value calculated elsewhere can produce an apparent mismatch that is really a difference in convention.
What a purity percentage measures
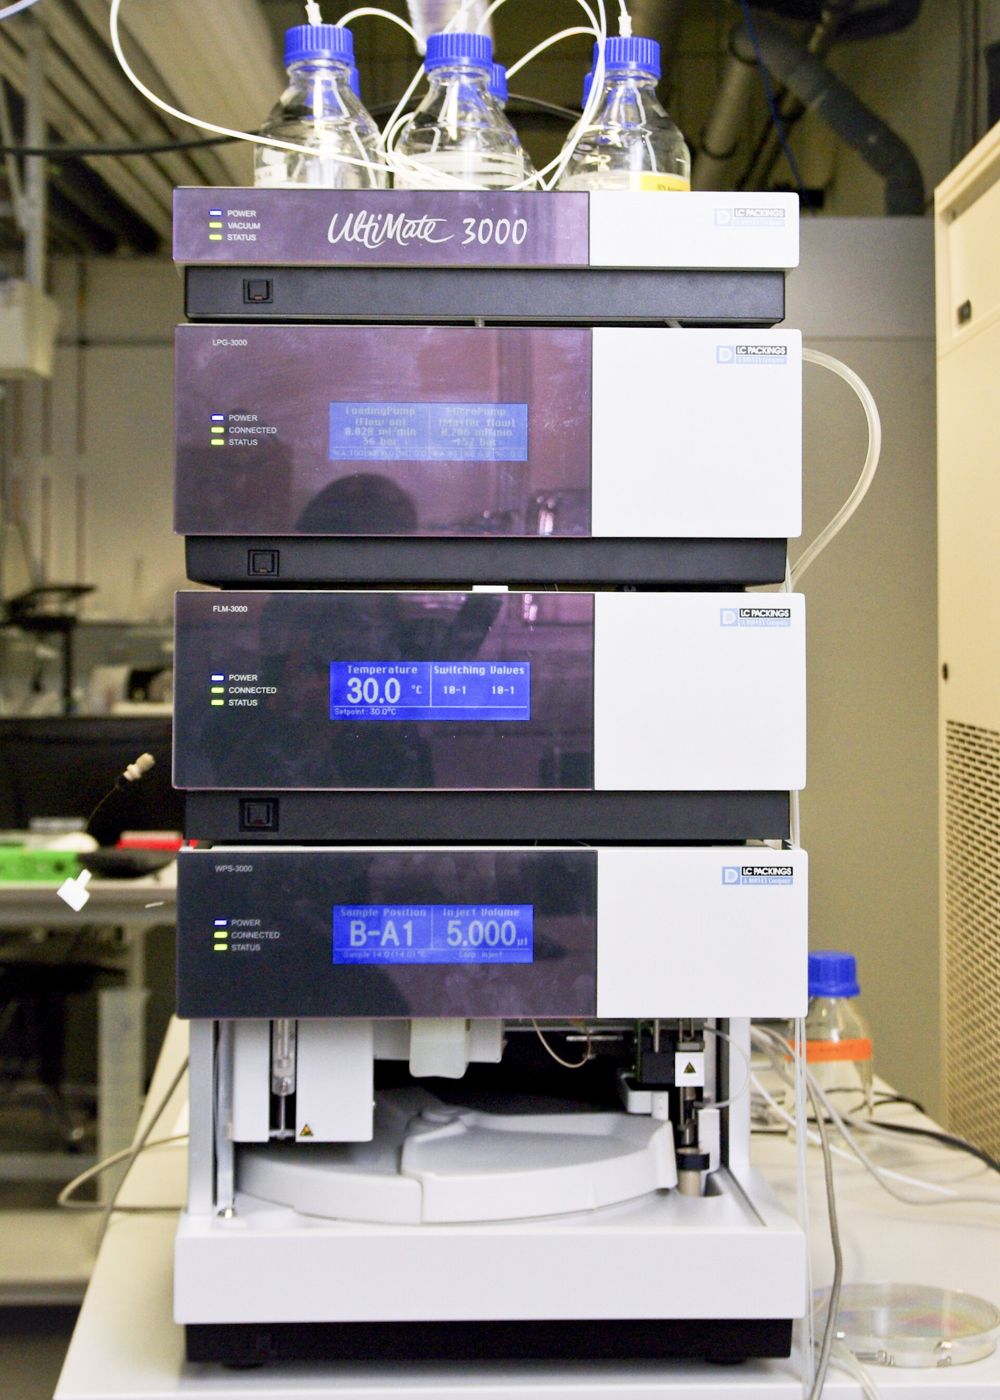
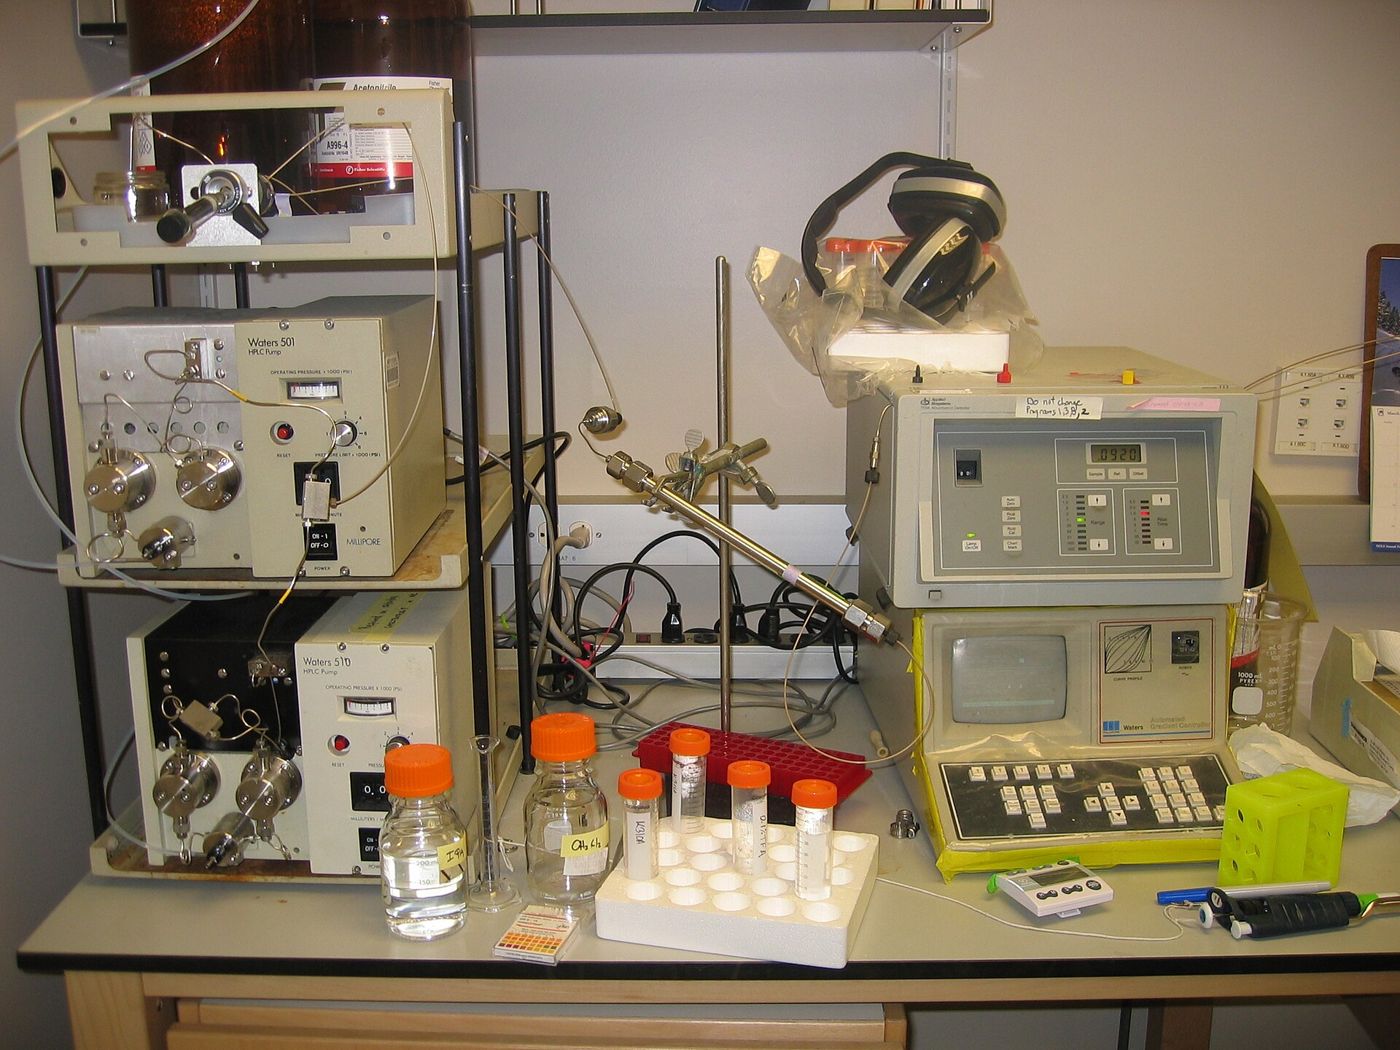
On most peptide certificates, purity is determined by reversed-phase high-performance liquid chromatography with UV detection, typically between 210 and 220 nm, where the peptide bond absorbs. Purity is reported as the area of the main peak divided by the total area of all integrated peaks. This area-percent calculation is explained step by step in our guide to peptide HPLC purity testing.
Area percent treats every component as if it absorbed UV light equally per unit of material, which is approximately true for closely related peptide impurities at low wavelengths but not exact. It counts only what the detector sees, so anything that does not absorb at the chosen wavelength, or never elutes from the column, is invisible. And it depends on the method: a different gradient, column or wavelength can resolve impurities that previously co-eluted with the main peak, changing the result. USP general chapter <621> sets out chromatographic terminology and system suitability expectations, while ICH Q2(R2) describes how analytical procedures are validated for characteristics such as specificity and precision.
The impurities themselves are usually peptide-related. Solid-phase synthesis (Merrifield, 1963) builds a chain one residue at a time, and each step can leave by-products: deletion or truncated sequences from incomplete coupling, residues whose protecting groups were not fully removed, oxidized methionine, deamidated asparagine or glutamine, and diastereomers formed by racemization. Area-percent purity reports how much of the chromatogram these occupy, not which of them are present.
Net peptide content
A lyophilized peptide powder is never 100% peptide by weight, even when its chromatographic purity is very high. Synthetic peptides are normally isolated as salts, because the N-terminus and basic side chains pair with counter-ions from the cleavage and purification steps. Trifluoroacetate is common after reversed-phase purification with TFA-containing mobile phases; acetate or chloride appear when a salt exchange has been carried out. Lyophilized material also retains residual water. Whether a particular lot has been characterized for these non-peptide components is a question for its batch documentation, which can be retrieved by lot number through the certificate of analysis lookup.
Net peptide content expresses the peptide fraction of the total powder mass. It is commonly determined by quantitative amino acid analysis, in which the sample is hydrolyzed and the released amino acids are measured, or by elemental nitrogen analysis, sometimes with counter-ion and water content measured separately. Net peptide content and purity answer different questions. A sample can be highly pure by HPLC yet contain noticeably less than its labelled weight of actual peptide, because the remainder is counter-ion and water that the chromatographic method never measures. For laboratory solutions of defined molar concentration, that difference matters.
Reading molecular weight and purity together
Each figure has a blind spot that the other partly covers. HPLC purity shows that one component dominates the sample, but the chromatogram cannot say what that component is: a wrong sequence that happened to synthesize cleanly would still give a single sharp peak. Mass spectrometry shows that a species of the expected mass is present, but says little about how much of the sample it represents, and it cannot distinguish sequences that share a mass, such as those differing only by leucine versus isoleucine or by the stereochemistry of one residue. The complementary roles are discussed further in our article on peptide testing for purity versus identity.
LC-MS, in which the HPLC column feeds directly into a mass spectrometer, assigns a mass to each peak. An analyst can then confirm that the main peak is the intended peptide and tentatively assign impurity peaks, for example a deletion sequence lighter by one residue mass or an oxidation product about 16 Da heavier than the parent.
The table below summarizes what each value tells a reader and what it leaves out.
| Value | What it tells you | What it does not tell you |
|---|---|---|
| Theoretical molecular weight | The mass expected from the sequence and its modifications | Anything about the physical sample |
| Observed mass (MS) | Whether a species of the expected mass is present | How much of it there is; isobaric variants |
| HPLC purity (area %) | The share of UV-detected material in the main peak | Water, salts and non-absorbing components; what the main peak is |
| Net peptide content | The peptide fraction of total powder weight | Whether that peptide is the target or a related impurity |
Practical points when reviewing documentation
On any certificate, check whether the molecular weight is labelled as average or monoisotopic, whether the purity method states its detection wavelength, and whether an observed mass is reported alongside the theoretical value rather than the theoretical value alone. A certificate that lists only a calculated molecular weight has not demonstrated identity; it has restated the sequence. If net peptide content was not measured, treat the labelled quantity as gross powder weight.
Recording these values with the lot number in the laboratory notebook preserves the material’s provenance. For a broader view of how these measurements fit together at batch level, see our overview of peptide purity testing, and for a field-by-field walkthrough of the whole document, read how to read a peptide certificate of analysis.
References
- United States Pharmacopeia. General Chapter <621> Chromatography.
- International Council for Harmonisation. ICH Q2(R2): Validation of Analytical Procedures.
- International Council for Harmonisation. ICH Q6B: Specifications: Test Procedures and Acceptance Criteria for Biotechnological/Biological Products. 1999.
- Gross JH. Mass Spectrometry: A Textbook. Springer.
- Merrifield RB. Solid Phase Peptide Synthesis. I. The Synthesis of a Tetrapeptide. J. Am. Chem. Soc. 1963, 85, 2149.
Educational content for research use only. Not for human consumption. Nothing here is medical advice or a claim about safety or efficacy.