HPLC Peptide Purity Testing: How It Works
How reversed-phase HPLC separates a peptide from synthesis impurities, how area-percent purity is calculated, and what the method cannot detect.
 EMElena Marsh, PhDSenior Research Analyst, Analytical Chemistry~6 min read
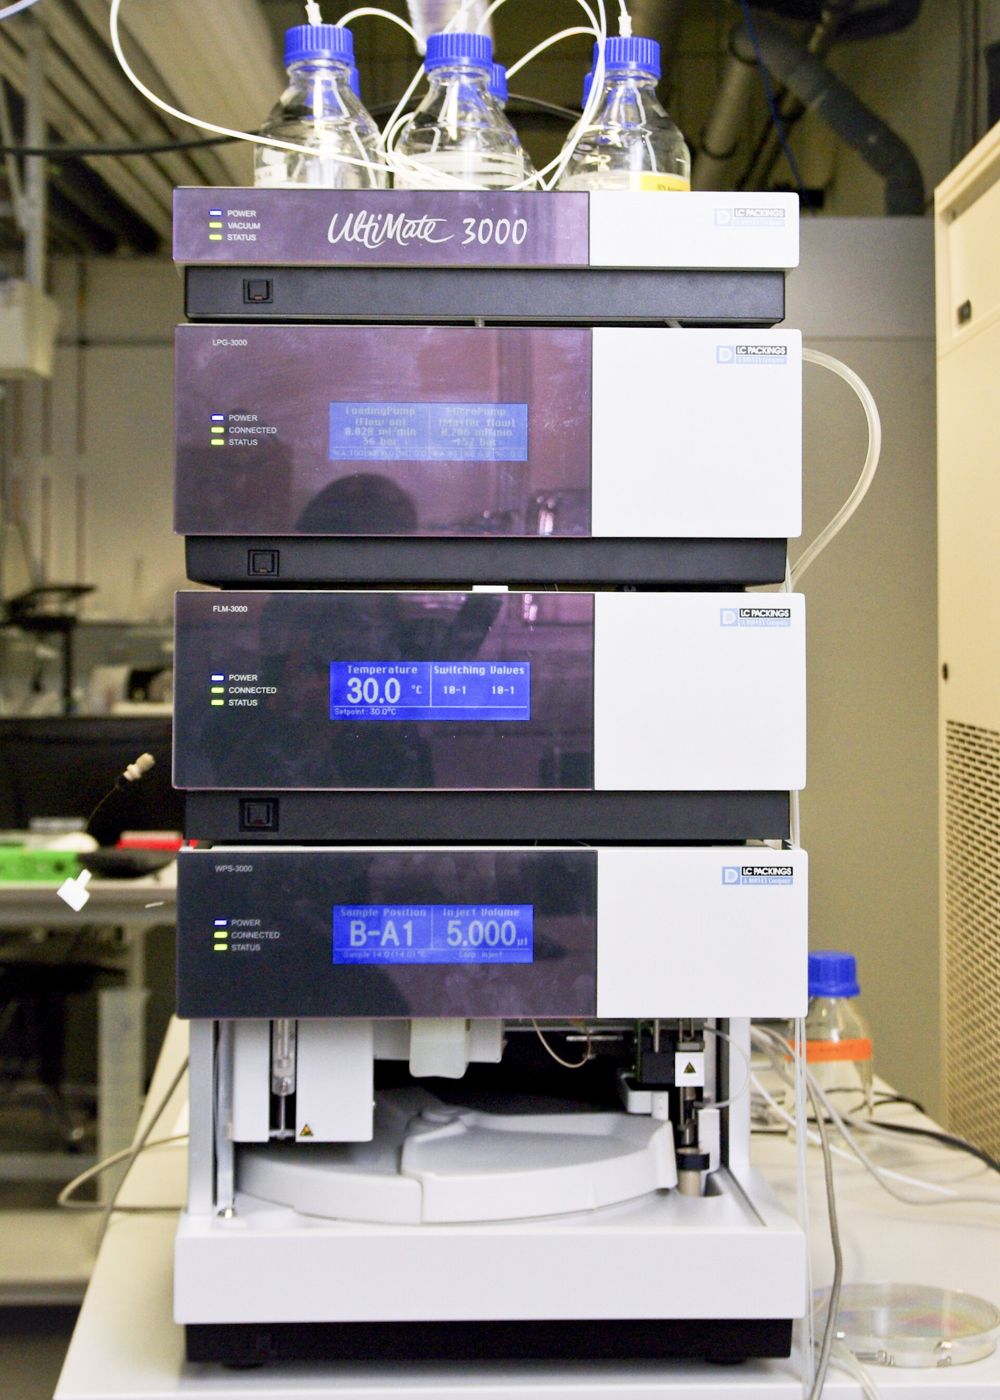 Analytical QCPhoto: Nadine90 / Wikimedia Commons, CC BY-SA 3.0
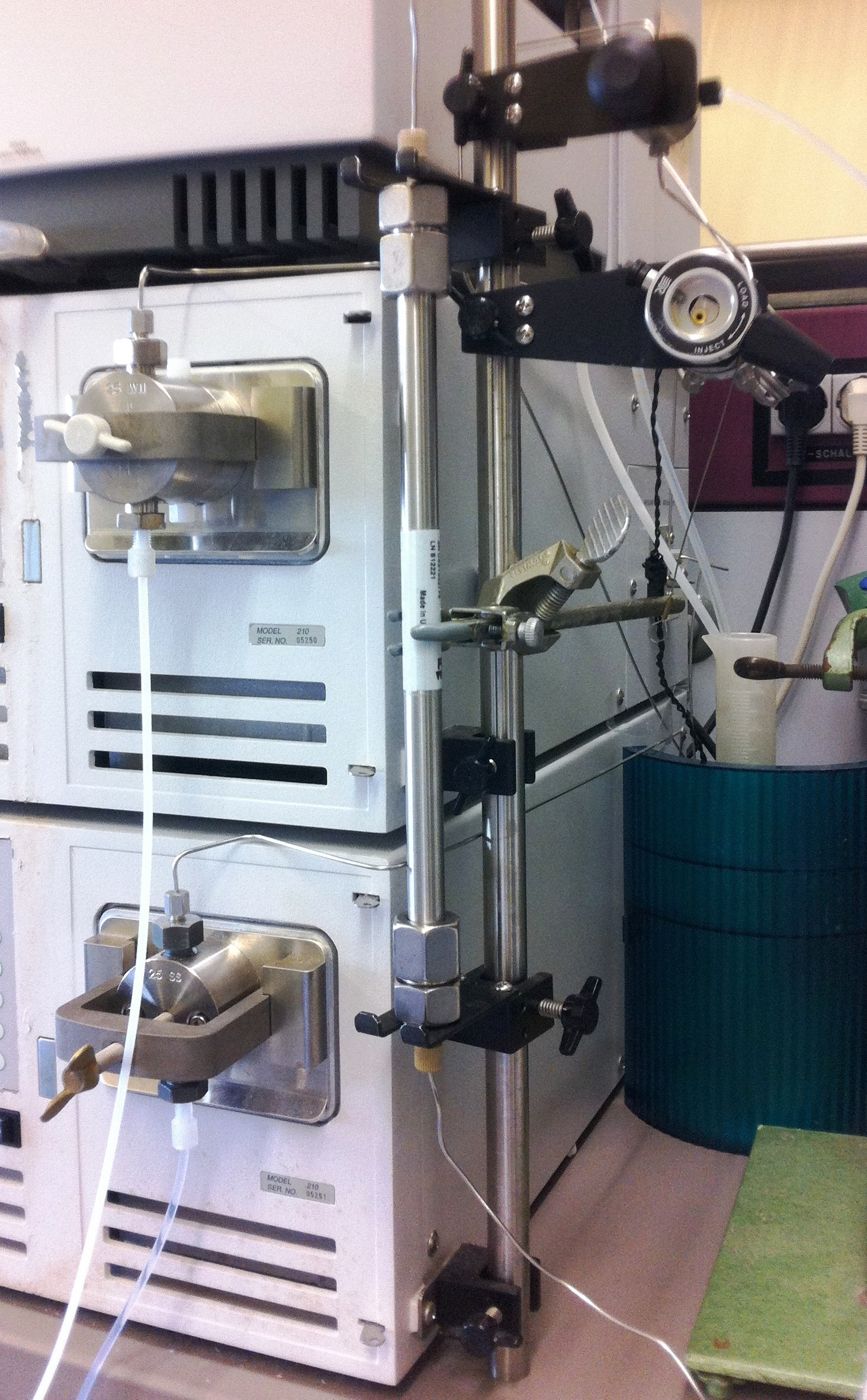
HPLC peptide purity is usually the first figure researchers look for on a certificate of analysis, and with reason: high-performance liquid chromatography is the standard technique for separating a synthetic peptide from the closely related impurities that solid-phase synthesis leaves behind. The method is mature, reproducible and sensitive, but the single percentage it produces is the end point of several choices about column chemistry, mobile phase, gradient, detection wavelength and peak integration.
This guide explains how reversed-phase HPLC separates peptides, how to read the resulting chromatogram, how area-percent purity is calculated, and where the technique’s blind spots lie. Knowing those details makes it easier to interpret a reported value and to judge whether figures from different sources can be compared at all.
How reversed-phase HPLC works
In reversed-phase chromatography the stationary phase is hydrophobic, most often silica particles bonded with C18 (octadecyl) or C8 alkyl chains and packed into a steel column. The mobile phase is polar: typically water and acetonitrile, each containing a small amount of an acidic modifier such as trifluoroacetic acid (TFA), commonly around 0.1%. TFA lowers the pH, keeps carboxyl groups protonated and forms ion pairs with positively charged residues, which sharpens peaks and improves reproducibility. Formic acid is often substituted when the eluent feeds a mass spectrometer, because TFA suppresses electrospray ionization.
The sample is loaded in a mostly aqueous solvent, where peptides adsorb to the hydrophobic surface. The analyst then runs a gradient, steadily increasing the proportion of acetonitrile. As the mobile phase becomes less polar, each peptide desorbs once its hydrophobic interaction with the stationary phase is overcome, and it travels on to the detector. Peptides that differ by a single residue, one oxidized side chain or the configuration of one amino acid usually differ slightly in hydrophobicity and therefore elute at different times. Shallow gradients, smaller particles and longer columns improve resolution at the cost of run time or back-pressure, and wide-pore packings (around 300 Ã ) are often chosen for larger peptides that would be partly excluded from small-molecule columns.
Choices like these are fixed in a written method and validated before routine use, which is why they sit at the heart of any quality testing approach for research peptides.
Reading a chromatogram
An HPLC run produces a chromatogram: detector response on the vertical axis plotted against retention time on the horizontal axis. Each component that absorbs at the detection wavelength appears as a peak. For a well-made synthetic peptide the trace is normally dominated by one large peak, with smaller peaks on either side.
A few features deserve attention. The retention time of the main peak is characteristic of the peptide under that specific method but not unique to it, so it supports identity only when matched against a reference standard run under identical conditions. Peak shape matters as well. A symmetrical peak suggests sound chromatography, whereas tailing, fronting or a shoulder can indicate a co-eluting impurity, column overload or secondary interactions with the stationary phase. Baseline behaviour is the third feature. Drift is common during gradients at low UV wavelengths and has to be handled consistently during integration, or it will distort peak areas. Early signals near the void volume are often injection artefacts or very polar species, and a well-documented method states whether they are excluded.
Impurities that elute just before the main peak are frequently more polar relatives, such as oxidized forms, while later-eluting peaks may be more hydrophobic species, for example sequences still carrying a protecting group. These are tendencies rather than rules. Assigning a peak with confidence requires mass spectrometry or a characterized reference material.
Area-percent purity
Area-percent purity is calculated by integrating every peak above a defined threshold and dividing the area of the main peak by the sum of all peak areas, multiplied by 100. As a purely illustrative example, a main peak of 980 area units in a chromatogram totalling 1,000 units corresponds to 98.0%. That single number is what normally appears in the purity field of the certificate of analysis for each production lot.
The calculation assumes that every component gives the same detector response per unit of material. At 210 to 220 nm, where absorbance comes mainly from the peptide backbone, closely related impurities respond similarly enough for the approximation to be useful, but it is not exact. Integration settings also shift the result: the peak-detection threshold, how overlapping peaks are split, and whether the baseline is drawn valley to valley or dropped perpendicular all change the final number slightly. Validated methods fix these parameters in advance. ICH Q2(R2) describes the validation characteristics expected of analytical procedures, including specificity, linearity, precision and detection limits, and USP general chapter <621> covers system suitability parameters such as resolution, tailing factor and repeatability that should be met before results are accepted.
Because the value is method-dependent, a purity figure is most informative when the certificate names the column, gradient and wavelength, or at least references a defined method. Our article on reading a peptide COA covers the other fields reported alongside purity.
Detection wavelength and its effect
Most peptide purity methods use UV detection between about 210 and 230 nm. In this region the amide bonds of the backbone absorb, so nearly every peptide and peptide fragment is detected. Detection at 280 nm instead relies on the aromatic side chains of tryptophan and tyrosine. It is more selective, but blind to peptides and impurities that lack those residues.
The same sample can therefore yield different purity values at different wavelengths. An impurity that had lost its only tryptophan would be invisible at 280 nm yet plainly visible at 214 nm. Low wavelengths have drawbacks of their own: mobile-phase components, TFA included, absorb in this region, which raises baseline noise and drift across the gradient. A purity figure without a stated wavelength is incomplete, and two figures measured at different wavelengths should not be compared directly.
What HPLC cannot tell you
HPLC with UV detection measures separation, not structure. A single peak shows that the sample behaves as one component under that method; it does not show that the component is the intended peptide. An entirely wrong sequence could elute as a clean, symmetrical peak. Identity must come from another technique, usually mass spectrometry, as described in mass spectrometry for peptide identity testing.
Co-elution is a second limitation. Impurities with nearly identical hydrophobicity, including some diastereomers, can hide beneath the main peak and inflate the reported purity. Orthogonal conditions, such as a different column chemistry or mobile-phase pH, or an LC-MS run, reduce that risk. Third, area-percent purity ignores anything that does not absorb at the chosen wavelength or does not elute: water, counter-ions like trifluoroacetate or acetate, inorganic salts and some aggregates. That is why net peptide content, the peptide fraction of total powder weight, is measured separately.
Interpreting HPLC purity in practice
A high HPLC purity value is good evidence that a peptide preparation is chromatographically homogeneous under a defined method. It becomes far more meaningful when it is paired with an identity result, a stated wavelength and a method description. When reviewing a lot, look for all three, and file the certificate with your experimental records so that results can later be traced to the material used. To check a vial’s lot number against its documentation, the COA lookup returns the record for that batch.
References
- United States Pharmacopeia. General Chapter <621> Chromatography.
- International Council for Harmonisation. ICH Q2(R2): Validation of Analytical Procedures.
- Snyder LR, Kirkland JJ, Dolan JW. Introduction to Modern Liquid Chromatography. Wiley.
- International Council for Harmonisation. ICH Q6B: Specifications: Test Procedures and Acceptance Criteria for Biotechnological/Biological Products. 1999.
Educational content for research use only. Not for human consumption. Nothing here is medical advice or a claim about safety or efficacy.