Mass Spectrometry for Peptide Identity Testing
How mass spectrometry confirms that a peptide has the expected molecular mass, how ESI spectra are deconvolved, and why mass alone is not the whole story.
 EMElena Marsh, PhDSenior Research Analyst, Analytical Chemistry~6 min read
 Analytical QCPhoto: Nadine90 / Wikimedia Commons, CC BY-SA 3.0
Mass spectrometry is the principal technique for confirming that a synthetic peptide is the molecule it is meant to be. Where HPLC reports how much of a sample elutes as one component, mass spectrometry measures the mass of that component so it can be compared with the value calculated from the intended sequence. On most certificates of analysis, the mass spectrometry peptide identity result is the line that answers a basic question: is this the right compound?
This article covers how peptides are ionized for analysis, why an electrospray spectrum shows several peaks for a single molecule, how observed and theoretical masses are compared, and where mass alone falls short. It also explains why mass spectrometry is routinely paired with chromatography rather than relied on in isolation.
Ionization methods: ESI and MALDI
A mass spectrometer can only measure ions, so the first step is to move peptide molecules into the gas phase carrying a charge. Two soft ionization techniques developed in the late 1980s made this practical for peptides and proteins without breaking them apart, and the work was recognized in the 2002 Nobel Prize in Chemistry, shared by John Fenn and Koichi Tanaka with Kurt Wüthrich.
Electrospray ionization (ESI)
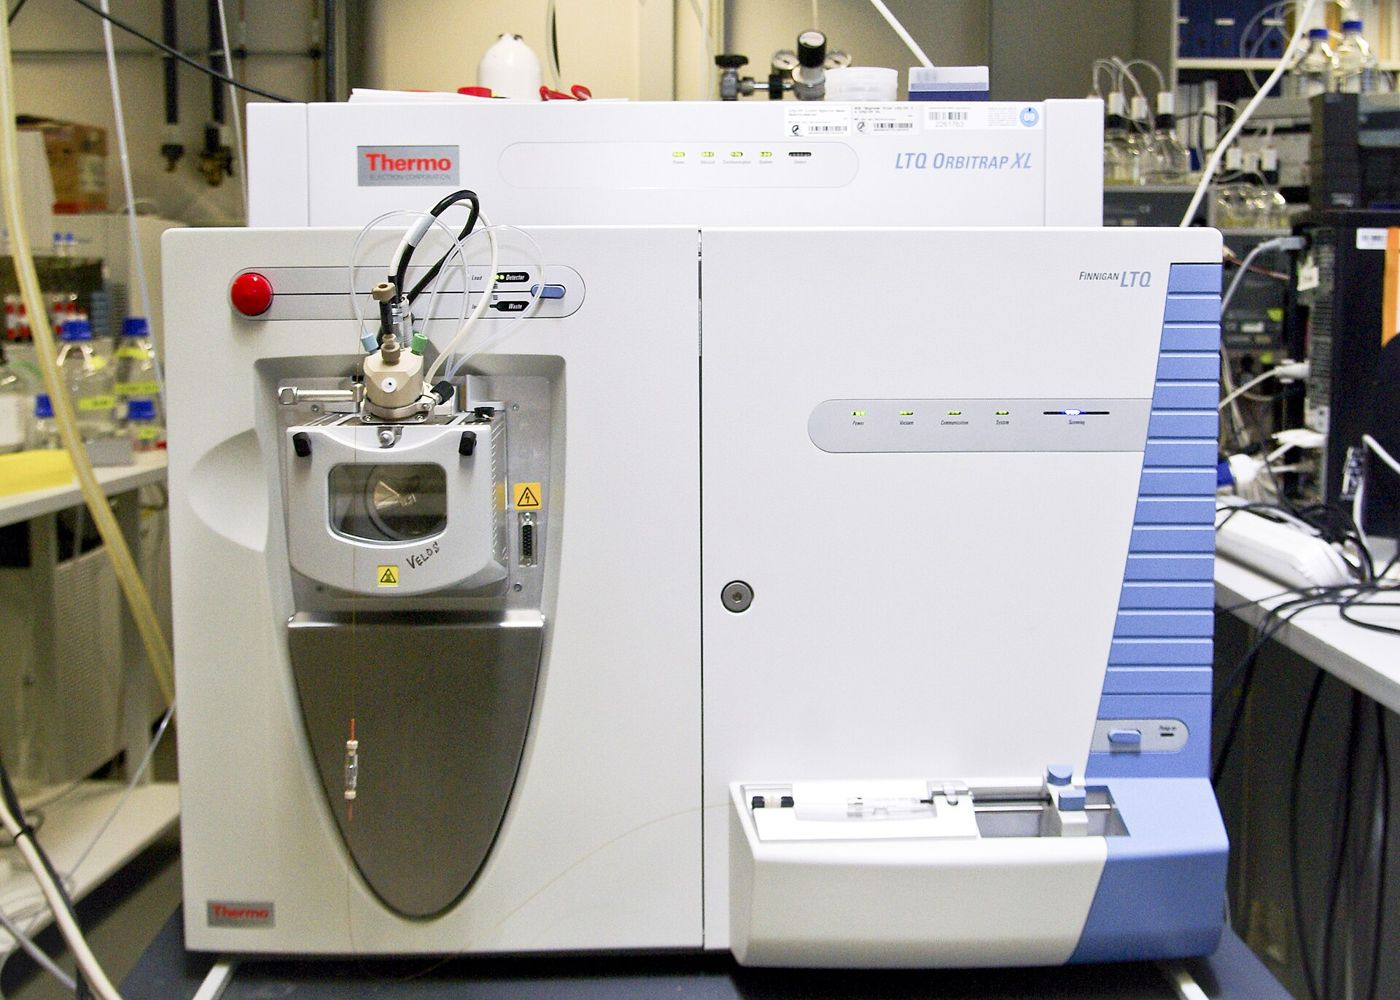
In ESI, a peptide solution is pumped through a fine capillary held at high voltage. The liquid disperses into charged droplets, the solvent evaporates, and ions are released into the gas phase. Peptides typically accept several protons at basic sites such as the N-terminal amine and the side chains of lysine, arginine and histidine, so ESI produces multiply charged ions written as [M+nH]n+. Because it works directly from a liquid stream, ESI couples naturally to HPLC, forming the basis of LC-MS. Where that combination fits into routine batch release is summarized in our quality testing overview.
Matrix-assisted laser desorption/ionization (MALDI)
In MALDI, the peptide is mixed with a large excess of a small UV-absorbing organic matrix, such as α-cyano-4-hydroxycinnamic acid, and dried onto a target plate. A pulsed laser excites the matrix, which desorbs and ionizes the analyte. Peptide MALDI spectra are dominated by singly charged [M+H]+ ions, which makes them straightforward to read. MALDI is usually paired with time-of-flight analysers and tolerates some salts and buffers better than ESI, but it is less convenient to couple to online chromatography.
Charge states and deconvolution
The instrument measures mass-to-charge ratio (m/z), not mass. For a peptide carrying n protons, each m/z value equals the neutral mass plus n proton masses (about 1.007 Da each), divided by n. A single peptide therefore appears in an ESI spectrum as a series of peaks, one per charge state. A peptide with a neutral mass near 3,000 Da would give ions at roughly m/z 1,001 (3+), 751 (4+) and 601 (5+).
Deconvolution is the computational step that converts this series back into a single neutral mass. Software groups peaks that belong to the same species, infers their charges and calculates the mass consistent with all of them. On high-resolution instruments the charge can also be read from the isotope pattern: adjacent isotope peaks are spaced by about 1/n on the m/z axis, so peaks 0.25 units apart indicate a 4+ ion. Deconvolution is dependable for clean samples but can generate artefacts when signals overlap or are weak, so the raw spectrum remains the more fundamental record.
Comparing observed and theoretical mass
The theoretical mass is calculated from the sequence, including terminal modifications, disulfide bonds and any other structural features. The comparison must be like for like. High-resolution spectra of small and mid-sized peptides resolve individual isotope peaks, and the lightest of these corresponds to the monoisotopic mass. Lower-resolution spectra, and spectra of larger peptides, are better compared with the average mass. Mixing the conventions can create an apparent error of a dalton or more for a peptide of a few kilodaltons, a point explained further in peptide molecular weight and purity.
Agreement is judged against the instrument’s mass accuracy. High-resolution analysers such as Orbitrap and modern time-of-flight instruments can achieve accuracy in the low parts-per-million range when well calibrated, while lower-resolution instruments may be limited to a fraction of a dalton. A laboratory should state the tolerance it applies, and ideally that tolerance is printed next to the observed and theoretical values on the lot-specific certificate of analysis.
Discrepancies are often diagnostic. Familiar shifts include about +22 Da for a sodium adduct in place of a proton, +38 Da for potassium, +16 Da for oxidation of methionine or tryptophan, and +0.98 Da for deamidation of asparagine or glutamine, which is easily confused with the first 13C isotope peak. A deletion sequence is lighter by one residue mass, and a loss of 2 Da relative to the reduced form indicates a disulfide bond. Recognizing these patterns lets an analyst explain an unexpected peak rather than simply reporting a failure.
Limits of mass alone
A correct mass is necessary evidence of identity but not sufficient. Several kinds of variation leave the mass unchanged. Leucine and isoleucine share an elemental composition, so substituting one for the other cannot be detected from intact mass. Racemization of a single residue from the L- to the D-configuration, which can occur during synthesis, creates a diastereomer of identical mass. Sequence scrambles, with the same residues in a different order, are isobaric as well, and at low resolution some unrelated residue combinations are close enough in mass to be indistinguishable.
Tandem mass spectrometry (MS/MS) addresses part of the problem. A selected ion is isolated and fragmented, usually by collision with an inert gas, and the resulting b- and y-ion series reveal the order of residues along the backbone. MS/MS can expose scrambled sequences, but under standard collision conditions it still cannot tell leucine from isoleucine, and it does not resolve stereochemistry. Those questions need chiral amino acid analysis, comparison with a reference standard, or chromatography capable of separating diastereomers.
Mass spectrometry is also not inherently quantitative. Different species ionize with different efficiencies, so relative peak heights in a spectrum do not reliably reflect the relative amounts present in the sample.
Pairing mass spectrometry with HPLC
For these reasons identity and purity are assessed together. HPLC with UV detection estimates how much of the sample is one component; mass spectrometry establishes what that component is. Neither answers both questions, as discussed in our guide to peptide testing for purity versus identity, while the chromatographic side is covered in our article on HPLC purity testing.
LC-MS combines the two in one run. The column separates the sample, and the mass spectrometer records spectra as each peak elutes. The analyst can confirm that the main peak carries the expected mass and assign masses to impurity peaks, which helps identify deletion sequences, oxidation products or incompletely deprotected species. ICH Q6B, written for biotechnological products, reflects the same principle by treating identity, purity and impurities as distinct parts of a specification, each requiring suitably specific methods.
What to look for in an identity result
When reading a mass spectrometry result, check that both the theoretical and the observed mass are given, that it is clear whether they are monoisotopic or average values, and that the ionization method or instrument type is named. A certificate that lists only a calculated molecular weight has restated the sequence rather than demonstrated identity. For a particular batch, the online COA lookup returns the documented results for that lot number.
References
- Fenn JB, Mann M, Meng CK, Wong SF, Whitehouse CM. Electrospray ionization for mass spectrometry of large biomolecules. Science. 1989;246:64–71.
- Karas M, Hillenkamp F. Laser desorption ionization of proteins with molecular masses exceeding 10,000 daltons. Analytical Chemistry. 1988;60:2299–2301.
- Gross JH. Mass Spectrometry: A Textbook. Springer.
- International Council for Harmonisation. ICH Q6B: Specifications: Test Procedures and Acceptance Criteria for Biotechnological/Biological Products. 1999.
Educational content for research use only. Not for human consumption. Nothing here is medical advice or a claim about safety or efficacy.